Mathematically quantifying error a.k.a. being right about how wrong you are.
Recently in Physics Club, we have been preparing for the first test in the Physics Olympiad series, the F = ma contest. The majority of the problems can be solved using basic equations of motion, but occasionally a problem comes up that requires some intuition. And these “intuitive” problems can be much trickier to solve mathematically than they appear to be.
A perfect example is Problem 25 on the 2016 F = ma contest which can be simplified down to this:
Christina measures a 1.5 meter piece of string with a meter stick, making two measurements which each have an error of  0.1
0.1
Alice measures the same 1.5 meter length of string with a 2 meter stick, making one measurement which has an error of 0.2

Who makes the more accurate measurement?
Initially, the group came to a consensus that the two measurements are equally good because they both have the same maximum error of  0.2 and an expected error of 0 (because the positive and negative error cancels out). But then somebody brought up the point that Christina’s measurements could “cancel out” if one was positive and the other was negative. Christina’s two measurements can combine to have zero error in multiple ways (for example, an error of +0.05 and then -0.05) while Alice’s measurement can only be error-free if he randomly gets that exact value. So Christina’s measurement must be better than Alice’s. This is actually the correct answer but this line of reasoning isn’t particularly helpful for figuring out specifics. How much better is Christina’s measurement? What if each of her measurements had an error of 0.175? How would having a normally distributed range of errors (rather than randomly distributed) affect the results? To answer these questions we need a mathematical solution to the problem.
First, we have to determine a mathematical definition of accuracy. Since we are dealing with probability, accuracy should be some sort of expected value. However, the expected value for the error doesn’t help us: it is zero for both cases. Instead, we have to take the absolute value of the error and calculate the expected value of that. Now we can simplify this problem down even further.
Randomly pick a number  randomly such that
  (I’m using 1 instead of 0.1 because I prefer to work with whole numbers and it doesn’t really make a difference)
Randomly pick another number  with the same constraints.
Calculate the expected value of  and compare to the expected value of
  where p is randomly chosen such that
It is easy to see that the expected value of where p is randomly chosen such that is 1. Since  has an even probability distribution, all we need to show is that has an average value of 1. This is pretty clear from a graph of p vs. or
 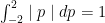 .
.

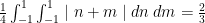
Finding the expected value of is quite a bit trickier, especially when you realize that  . We can apply the same process we used above but we have to graph in 3 dimensions because we now have an additional variable. Put n on the x axis, m on the z-axis, and the error on the y-axis. The function now defines a plane that looks something like this:

The area under this plane can be calculated by finding the volume of 2 right tetrahedrons using the volume of a right tetrahedron formula ( where a, b, and c are the lengths of the sides that from the right angle).

So:


 (4 is the area of the base of the cube)
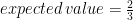
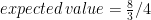
So the average error in Christina’s measurement is 0.0667 compared to Alice’s average error of 0.1! Each of Christina’s measurements could be up to 0.15 off, and her measurement would be equal to or better than Alice’s in terms of accuracy. You can do the same thing to determine expected error if each of Christina’s measurements had a different error (for example, if her first measurement was accurate within  while her second was only accurate to within
  ) by drawing distorted tetrahedrons and calculating their volumes. But what if Christina took 3 measurements? Or 10? There is no way we can imagine and calculate volumes in 11 dimensional space. To do this problem, we have to recognize that what we just did above was calculate a double integral.
Namely:
If we want to do the same thing for 3 measurements (each accurate to within  , we would simply take the triple integral. The number in front would change to
  as well. Why? Because that number represents the probability distribution function for the individual errors. When there was just one randomly selected variable such that , it was
  since the distribution function of p looked like a horizontal line through (0, because every had the same chance of being chosen. When there were two variables, the coefficient was still because the distribution functions of both n and m were a horizontal line through (0,
  ) and
) and  . This also answers the question of what happens when the probability distribution of the error is a normal distribution, you just plug the Gaussian into your integral before calculating. The calculus gets quite messy at that point, however, so I’m not going to do an example.
Basically, for some arbitrary number of measurements where  is the probability distribution function for x, we get:

But to do the original problem we didn’t need calculus at all, we just needed (interestingly enough) tetrahedrons and an understanding of probability.
