The universe seems like a dauntingly large place. Our minds can barely comprehend distances between bodies within our own solar system – such as the 93 million miles separating the Earth and the sun – let alone the vast spaces between galaxies. Even when we use the fastest possible motion in the entire universe (the speed of light) to quantify these distances, they remain staggeringly large: it’s 2.5 million light-years to our next-door neighbor, the Andromeda Galaxy. And our Milky Way galaxy and the ones nearby are just the beginning…

Images like this one from the Hubble Space Telescope are extremely popular because they illustrate the sheer vastness of the universe. Thousands of galaxies pepper just this one image, each one consisting of millions of solar systems, stars, and planets. Just look at this photoseries which zooms out from Earth until the observable universe is in view. Carl Sagan’s famous “pale blue dot” quote doesn’t just describe Earth, at the right scale it describes our solar system, our galaxy, and even our local supercluster. It’s hard not to feel insignificantly small on such an unimaginably large backdrop.
So imagine how surprised I was when I learned of a theory that the universe could be contained in a sphere the size of the Earth. It posits that the Earth is hollow and we live on the inside (along the perimeter) and all celestial bodies are contained within Earth’s roughly 8,000 mile diameter.

This seems utterly deranged at first; not even on par with flat-Earthers or conspiracy theories claiming the Earth is hollow and filled with secret “inner-Earth” societies. There are dozens of experiments that prove that the Earth is a rotating sphere hurtling through space, including Foucault’s pendulum and Eratosthenes’ shadow experiments. For that matter, when we look up its not like we see people from across the world looking back down at us!
However, this theory can be backed up mathematically and in fact living in this “nutshell Earth” (a term coined by Martin Gardner when examining and ultimately rejecting the theory) is indistinguishable from our current hypothesis of the structure of the universe (the Copernican model).
How can this be? Well, there exists a method for mapping all points on a plane into points in a circle of fixed radius. This is called inverting the circle. It works as follows:

- Select a point P outside the circle
- Draw a straight line between P and the center of the circle O
- Find M, the midpoint of the line between P and O
- Draw another circle with center M and going through P
- Draw a straight line between N and N’, the points where the two circles intersect
- P‘ is where OP and NN‘ intersect
In this manner, any point outside the plane maps to one and only one point within the circle. Reversing the process means that every point in the circle (except the exact center of the circle) maps to one and only one point outside the circle. The further away the original point is from the circle’s edge, the closer its inverse will be to the center of the circle. Only a point infinitely far away from the circle will map to the circle’s exact center.
If you want to mess with this a bit more and get a better idea of what circle inversion actually does, this applet allows you to see what your drawings look like after being inverted into a circle.
Essentially the same process of inversion can be generalized into three dimensions to map any point in a volume to a point within a fixed radius sphere. So if we imagine the Earth to be hollow and the universe to surround it, we can apply this perspective transformation to place every object in the observable universe within the hollow sphere. The heavenly bodies become miniscule, but each and every one can coexist in our nutshell Earth.
So there is a mathematical method for transforming all the universe into a sphere the size of the Earth without losing any information (as the transformation can be applied in reverse to regain the much larger Copernican model). The Earth’s surface maps to itself (with us living on the inside surface of the hollow sphere) and all of outer space becomes embedded within, with the farthest galaxies closest to the origin point of the sphere. The Egyptian mathematician Mostafa A. Abdelkader, the most sophisticated defender of the nutshell Earth theory, described such an inversion in his article “A Geocosmos: Mapping Outer Space Into a Hollow Earth” published in 1983.
After inversion, the moon, our closest celestial neighbor, maps to a sphere 955 meters across that circulates around the Earth’s axis from 6265 kilometers above Earth’s surface (all these observations are are from a perspective outside the nutshell and therefore outside the universe). The sun shrinks to about 2.5 meters across and recedes to a location a mere 253 meters from the origin point (which is the center of the universe). Pluto shrinks to the size of a single bacterium orbiting seven meters from the origin, while Alpha Centauri, the star closest to our own Sun, becomes an infinitesimally small speck situated a mere millimeter from the origin. Every other star and object in the cosmos, therefore, is contained in a sphere less than two millimeters across that hovers 6371 kilometers above our heads.
But even if you can accept this strange idea, what about the phenomena we observe that demonstrate the Earth’s movement through space? To give a fairly prominent example, how does this theory explain the daily sunrise and sunset?
Well, this is where it gets interesting. For a nutshell Earth to mesh with observed phenomena, the laws of physics must also be inverted. The behavior of gravitational, electromagnetic, and light waves is distorted to create a new, consistent “inverted physics” that explains the observations that conventionally lead us to a Copernican universe in a nutshell Earth.

The changed behavior of light rays are perhaps the most striking feature of the new model. In the Copernican cosmos, rays of light travel in straight lines. The position of the sun in relation to the observer determines what they will see. In the figure, an observer stationed under ray C will be experiencing solar noon while an observer stationed under ray A will be watching a sunset. As the Earth rotates on a 24 hour cycle, people on Earth experience the change from day to night.
So the sun moving across the sky is a point in favor of the Copernican model, right? Actually, no. The inverse mapping preserves angular relationships, so that observers positioned in the nutshell Earth would experience exactly the same phenomena as those in a Copernican universe.


In the nutshell Earth, light rays can follow curved paths according to the inverted laws of physics. A maps into as ray a, and an observer positioned at ray h’s intersection point would observe the sun on the horizon. Because the Sun rotates around the origin, O, the observer would see it as setting, exactly as does the observer in the Copernican cosmos. Just as in the previous figure (representing the Copernican model), an observer intercepting ray c would be experiencing solar noon and a person observing b would see the sun as being somewhere between the horizon and the solar zenith.
Rays D and E do not intersect Earth in the Copernican universe and, assuming they do not intersect anything else, will continue traveling to infinity. In the nutshell Earth, however, d and e travel in arcs that lead back to the origin. The rays never actually reach the origin, however, because the inversion operation affects not only the direction of light rays, but their velocities as well. The speed of light is constant in the Copernican universe, but variable in the nutshell Earth, ranging from 
The result of these conditions is that all observations and estimates of the size, direction and distance of any celestial object would lead to exactly the same result for an observer on the outside of Earth in a Copernican universe and his image observer inside the nutshell Earth, no matter where they are with respect to Earth’s surface.

Similarly, other phenomena such as the movement of Foucault pendulums are accounted for by other inverted laws of physics. explained conventionally as effects arising from Earth’s rotation about its axis. The direct isomorphism between the Copernican universe and the nutshell Earth means that its is impossible to refute it as a valid model based on empirical tests. Every possible observation made in a Copernican universe has its exact analogue in the nutshell Earth. This also means that it is impossible to prove the nutshell Earth theory. Evidence such as the Tamarack Mines plumb lines which is commonly used by conspiracy theorists to “prove” the surface of the Earth is concave don’t apply to the nutshell Earth theory because they don’t mesh with its inverted laws of physics.
So if we can’t prove or disprove the nutshell Earth theory, what exactly is it? Well, it’s really more of a thought experiment. We rarely look at the assumptions we make when describing the structure of the universe. Our observations match the Copernican idea of the universe, given we accept the untestable (though understandable) assumption that light always propagates in straight lines. But if we make a different set of untestable assumptions? We end up with the nutshell Earth.
I mentioned before that prominent physicist Martin Gardner rejected the nutshell Earth theory. He did this on the basis of Occam’s Razor – which holds that when given two choices with the same explanatory and predictive power, we should adopt the simpler one. Increased complexity is acceptable only when it yields a better theory in terms of explaining or predicting observations. For example, Einstein’s relativity added complexity to Newtonian physics but it also allowed us to explain certain natural phenomena, like small deviations in the orbit of Mars. The nutshell Earth requires significantly more mathematical complexity (see below) and exchange we get only the security blanket of believing that our little planet is important in the vast scheme of things.

And even this security blanket is rather thin and possibly nonexistent. Gardner points out that the nutshell Earth model of the universe doesn’t require a nutshell Earth, it’s just as likely to be a nutshell Moon or Mars or Sun or Planet X. There are an estimated 


So if the justification for selecting a nutshell Earth is only an artifact of our human tendency towards geocentrism, why not take it even further towards egocentricism and map the universe to your own mind? Inverting the universe with respect to your brain means that your skull contains every star, galaxy, asteroid, and speck of dust in the cosmos. That has got to relieve some of those feelings of cosmic insignificance. Feel content in the knowledge that it is empirically impossible to disprove the theory that you completely contain the universe. Lest others think you’re a bit crazy, I would suggest storing this knowledge safely along with the rest of the universe: in your own hollow nutshell of a mind.

 wide, centered at the anti-solar point, like this:


 because all the interior angles of a quadrilateral must add up to
  . This equation can be simplified down to
  . The relationship between
  and
and  is dependent on the refraction of light when it travels from one medium to another (in this case from air into water). Therefore, we can use Snell’s Law to calculate
  , where
  is the speed of light in air and
  is the speed of light in water. Using the index of refraction of water (
 ) simplifies the equation down to:

 :
:
 vs.
vs.  and see if we can understand why the rainbow forms where it does.
 but how does that relate to the formation of the rainbow? Well, since the sun is so far away, light rays enter each droplet of water parallel to each other. This means that every value of
  up to
up to  has the same amount of incoming sunlight. However, the outgoing angle of the light (

 for the different colors of light when graphing, the graph of incoming vs. outgoing angles looks like this:
 , which means that any rainbow you see will have a thickness of
  .
.

 :
:


 :
: (Pythagorean Identity)


 :
:


 , we get
  .
. .
.
 0.1
0.1
 0.2 and an expected error of 0 (because the positive and negative error cancels out). But then somebody brought up the point that Christina’s measurements could “cancel out” if one was positive and the other was negative. Christina’s two measurements can combine to have zero error in multiple ways (for example, an error of +0.05 and then -0.05) while Alice’s measurement can only be error-free if he randomly gets that exact value. So Christina’s measurement must be better than Alice’s. This is actually the correct answer but this line of reasoning isn’t particularly helpful for figuring out specifics. How much better is Christina’s measurement? What if each of her measurements had an error of 0.175? How would having a normally distributed range of errors (rather than randomly distributed) affect the results? To answer these questions we need a mathematical solution to the problem.
 randomly such that
  (I’m using 1 instead of 0.1 because I prefer to work with whole numbers and it doesn’t really make a difference)
 with the same constraints.
 and compare to the expected value of
  where p is randomly chosen such that
 has an even probability distribution, all we need to show is that
  .
.
 . We can apply the same process we used above but we have to graph in 3 dimensions because we now have an additional variable. Put n on the x axis, m on the z-axis, and the error on the y-axis. The function
 where a, b, and c are the lengths of the sides that from the right angle).


 (4 is the area of the base of the cube)
 while her second was only accurate to within
  ) by drawing distorted tetrahedrons and calculating their volumes. But what if Christina took 3 measurements? Or 10? There is no way we can imagine and calculate volumes in 11 dimensional space. To do this problem, we have to recognize that what we just did above was calculate a double integral.
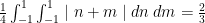
 , we would simply take the triple integral. The number in front would change to
  as well. Why? Because that number represents the probability distribution function for the individual errors. When there was just one randomly selected variable such that
  since the distribution function of p looked like a horizontal line through (0,
  ) and
) and  . This also answers the question of what happens when the probability distribution of the error is a normal distribution, you just plug the Gaussian into your integral before calculating. The calculus gets quite messy at that point, however, so I’m not going to do an example.
 is the probability distribution function for x, we get:


 is the mass density of the liquid,
  is gravity, and
  is the volume of the object. Remember, since water pressure is so crucial to buoyancy, it is important not to discount it when looking at buoyancy based “perpetual motion”.